Reading the Reports screen
Last updated: 27 August 2026
Reports breaks down usage into Daily, Weekly, and Monthly views, each with a trend chart up top and a grid of stat tiles below it.
Choosing a period
- Daily, Weekly, or Monthly tabs switch the whole screen's granularity.
- The date pill (e.g. "Aug 26") opens a calendar — for Weekly, picking any day selects that whole week; Monthly only needs a month, not a specific day.
- Arrows either side of the date step to the previous or next period.
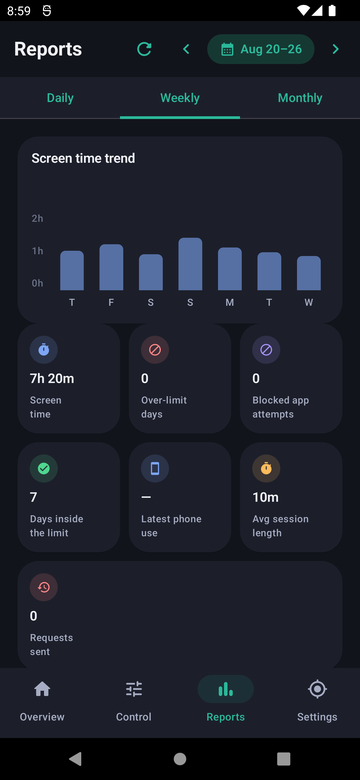
Reports — Daily view.
What each stat means
| Stat | What it's measuring |
|---|---|
| Screen time trend | A bar chart of usage across the period — by hour for Daily, by day for Weekly/Monthly. |
| Screen time | Total minutes used in the period. |
| Over-limit days | How many days usage exceeded the daily limit. |
| Blocked app attempts | How many times a blocked app was opened and stopped. |
| Days inside the limit | The flip side of over-limit days — how many days stayed within the limit. |
| Latest phone use | The most recent time the device was used. |
| Avg session length | Average continuous stretch of use. |
| Requests sent | How many "ask for more time" / unblock / bedtime-pause requests your child sent in the period. |
A Free plan sees 3 of these stats and 30 days of history; Pro unlocks all 7 stats and a full year — see Pricing for the full comparison.